The Air Quality Index is a standardized measurement tool that government agencies use to report daily outdoor air pollution levels. This numerical system translates complex atmospheric data into a simple score that anyone can understand.
Environmental scientists designed this metric to serve as a public health warning system. The scale runs from 0 to 500. Higher values indicate greater concentrations of pollutants and more severe health risks for the general public.
Historically, communicating pollution data to citizens proved difficult due to the complex scientific units involved. Researchers used parts per billion or micrograms per cubic meter to record chemical concentrations.
The average person struggled to interpret whether 15 parts per billion of ozone was safe or dangerous.
The introduction of a standardized index solved this communication problem perfectly. By converting obscure scientific measurements into a simple scale of 0 to 500, agencies empowered citizens to protect themselves.
A reading of 50 provides immediate reassurance, while a reading of 200 demands immediate caution.
Local news stations and weather applications broadcast these index numbers daily. Meteorologists use the data to warn residents about potential respiratory hazards in their specific neighborhoods.
Many people confuse standard weather forecasts with pollution reports. However, temperature and precipitation do not directly measure the chemical composition of the air we breathe.
The index specifically tracks harmful airborne particles and gases that enter the human respiratory system.
The economic benefits of this public awareness are substantial. When vulnerable individuals stay indoors during high pollution days, hospital admissions for asthma and heart attacks decrease.
This behavioral shift saves millions of dollars in emergency medical costs annually.
How the AQI Scale Works?
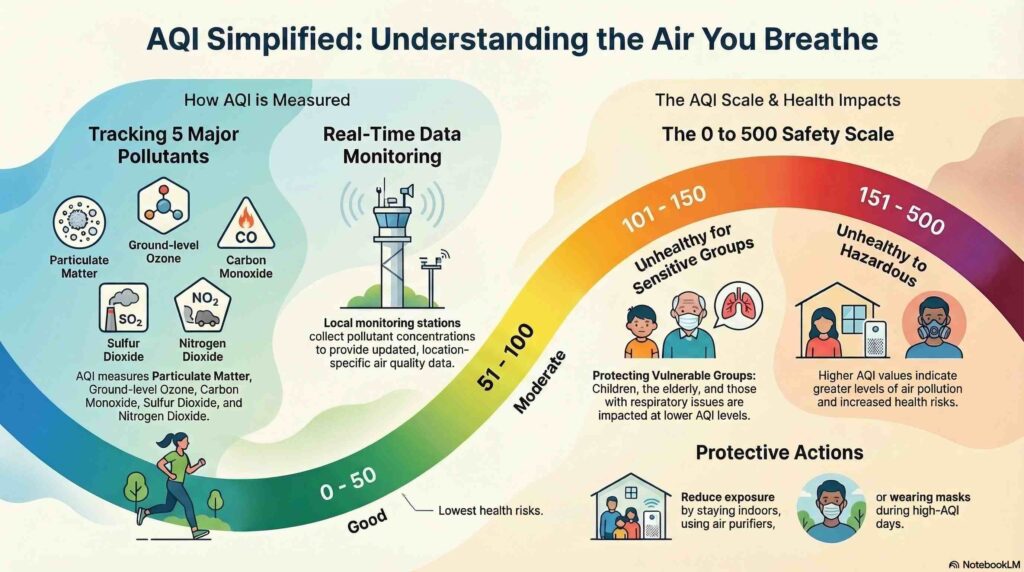
The numerical scale divides pollution levels into distinct brackets. A reading of 50 or below represents clean air with little to no health risk. When the number climbs above 100, the air becomes unhealthy for sensitive groups.
A reading above 300 triggers emergency health warnings for the entire population. Environmental agencies consider these extreme levels hazardous and advise everyone to remain indoors. These numbers provide an immediate snapshot of local air quality.
National governments standardize these measurements across their respective regions. This consistency ensures that a reading of 150 means the same thing in every city within that nation. Standardization allows health professionals to issue uniform safety guidelines regardless of geographic location.
Scientists established the value of 100 as the critical threshold for public health. This specific number aligns with the national ambient air quality standard for each individual pollutant. Agencies generally consider the air safe for the vast majority of citizens whenever the index drops below 100.
When readings exceed the 100 threshold, authorities legally must issue notifications. Government health departments collaborate with local media to broadcast these warnings promptly. Timely alerts allow schools to cancel outdoor sports practices before children face exposure to toxic air.
Key Pollutants Measured by the Air Quality Index
The Clean Air Act requires the United States Environmental Protection Agency to regulate five major air pollutants. Environmental monitoring stations continuously sample the atmosphere to detect these specific chemical compounds. Each pollutant affects human health differently and requires unique measurement techniques.
This diagram illustrates the various chemical components and pollutants typically included in comprehensive environmental computations.
Agencies establish national safety standards for each of these harmful substances. By tracking these specific elements, scientists can pinpoint exact sources of contamination in urban and rural environments.
Researchers have spent decades studying how these five primary elements degrade human respiratory function. They conduct controlled studies to observe how lung tissue reacts to varying concentrations of toxic gases. The results of these studies directly inform the mathematical formulas that agencies use to calculate the daily index.
Monitoring these substances requires sophisticated laboratory equipment installed at thousands of locations. These automated sensors operate around the clock to capture sudden fluctuations in local pollution levels. The continuous stream of data ensures that public warnings reflect real time atmospheric conditions.
Particulate Matter and Ozone
Particulate matter includes microscopic solids and liquid droplets suspended in the air. PM2.5 refers to fine particles that measure two point five micrometers or less in diameter. These tiny particles easily bypass the natural defenses of the human body and penetrate deep into the lungs.
Once inside the respiratory system, these microscopic fragments can cross directly into the bloodstream. Medical researchers link chronic exposure to fine particulate matter with increased risks of cardiovascular disease and lung cancer. Forest fires and diesel engines serve as primary sources of this dangerous airborne debris.
Ground level ozone forms when emissions from cars and factories react with sunlight. Unlike the protective ozone layer high in the stratosphere, this ground level gas causes severe respiratory irritation. Ozone concentrations typically peak during hot summer afternoons when sunlight shines most directly.
Breathing high levels of ground level ozone feels like getting a sunburn inside your lungs. It causes coughing, throat irritation, and an uncomfortable sensation in the chest. People who exercise vigorously outdoors during the summer face the highest risk of ozone related lung damage.
Other Major Air Pollutants
Fossil fuel combustion produces carbon monoxide, a colorless and odorless gas. Vehicles generate the majority of carbon monoxide emissions in modern urban centers. High levels of this gas reduce the amount of oxygen that human blood can deliver to vital organs.
Urban planners carefully monitor carbon monoxide levels near busy intersections and indoor parking garages. Because human senses cannot detect this gas, electronic sensors provide absolutely vital warnings for public safety. Prolonged exposure to high concentrations rapidly causes dizziness, confusion, and even loss of consciousness.
Power plants emit sulfur dioxide into the atmosphere primarily through the burning of coal and oil. This corrosive gas aggravates asthma symptoms and contributes heavily to the formation of acid rain. Communities located downwind from large industrial facilities frequently experience elevated sulfur dioxide levels.
Automobile exhaust and power plant emissions quickly form nitrogen dioxide, another highly reactive gas. It contributes heavily to the brownish haze often seen hanging over large metropolitan areas.
Breathing air with a high concentration of nitrogen dioxide irritates airways and increases susceptibility to respiratory infections.
The Six Air Quality Index Color Categories and Health Risks
Public health officials group the numerical values into six distinct color categories. This visual system allows individuals to glance at a map and instantly understand their local health risks. The color coding provides a universal language for environmental safety.
Each category corresponds to a specific level of health concern and comes with tailored behavioral advice. Healthy adults might tolerate moderate pollution, while children and the elderly require stricter precautions. The systematic use of colors makes environmental data easily accessible to children and nonnative speakers.
A bright red warning icon on a smartphone app universally communicates danger without requiring complex explanations. This design choice represents a major triumph in public health communication. Communities rely on this simple color system to plan daily routines safely.
| Category Name | Index Values | Assigned Color | Public Health Meaning |
|---|---|---|---|
| Good | 0 to 50 | Green | Air quality is satisfactory and poses little or no risk. |
| Moderate | 51 to 100 | Yellow | Acceptable air quality, but highly sensitive people may experience issues. |
| Unhealthy for Sensitive Groups | 101 to 150 | Orange | General public is fine, but sensitive groups face health risks. |
| Unhealthy | 151 to 200 | Red | Everyone may begin to experience adverse health effects. |
| Very Unhealthy | 201 to 300 | Purple | Health alert indicating everyone may experience more serious health effects. |
| Hazardous | 301 and higher | Maroon | Emergency conditions where the entire population is likely to be affected. |
This structured framework helps schools decide whether to hold recess outdoors during the academic year. Hospitals also use these categories to prepare for potential influxes of asthma patients during severe pollution events. Local governments often mandate industrial emission reductions when the index enters the purple or maroon zones.
The green category indicates perfect conditions for outdoor exercise and recreational activities. When the scale enters the green zone, parents can safely allow their children to play outside all day. This clean air status represents the ultimate goal of modern environmental protection policies.
The yellow category serves as an early warning indicator for highly sensitive individuals. While the vast majority of the public will notice no symptoms, people with severe asthma might experience mild chest tightness. Medical professionals advise these vulnerable patients to monitor their breathing closely during yellow days.
The orange category requires specific actions from sensitive groups to prevent unexpected medical emergencies. People with chronic obstructive pulmonary disease should actively reduce their time spent outdoors. Healthy adults can continue normal activities but should avoid running marathons near busy public roads.
The red, purple, and maroon categories represent escalating levels of environmental crisis. Red indicates that even healthy teenagers and adults will likely feel respiratory discomfort after prolonged outdoor exertion. Purple and maroon signify toxic atmospheric conditions that require emergency interventions and widespread public sheltering.
How Authorities Calculate Air Quality Daily?
Environmental agencies operate vast networks of monitoring stations to gather atmospheric data continuously. These sophisticated sensors measure the exact concentration of each major pollutant over specific time intervals. Computers then convert these raw scientific measurements into the standardized index values.
The calculation process relies on epidemiological research that links specific pollutant doses to measurable health outcomes. Scientists constantly review new medical data to ensure the index accurately reflects real world health risks. Revisions to the calculation formulas occur whenever new medical evidence reveals previously unknown dangers.
Data collection requires precise calibration of all scientific instruments working in the field. Technicians visit monitoring sites regularly to clean the air intakes and verify the accuracy of the chemical sensors. This rigorous maintenance schedule ensures that the public receives trustworthy and legally defensible data.
Several environmental factors can cause severe spikes in daily local pollution levels. Meteorologists track these atmospheric variables to forecast future air quality conditions accurately.
Common causes of sudden pollution increases include:
- Heavy automobile traffic during morning and evening rush hours.
- Smoke traveling from distant forest fires or agricultural burning operations.
- Stagnant weather patterns that trap toxic emissions close to the ground.
- Industrial accidents or unexpected factory emission releases.
- High temperatures combining with bright sunlight to accelerate toxic ozone formation.
- Wind patterns blowing dangerous dust from construction sites into residential areas.
- Winter temperature inversions that press cold polluted air down into mountain valleys.
Forecasting relies heavily on predicting how weather systems will interact with known pollution sources. A strong breeze can disperse heavy smog and clear the local air within a matter of hours. Conversely, a high pressure system can cause toxins to accumulate over a city for several consecutive days.
The Role of the Critical Pollutant
Monitoring stations measure multiple dangerous substances simultaneously throughout the day. However, authorities do not add these individual numbers together to create a cumulative total score. Instead, the computer system isolates the single highest reading from all the gathered data.
The substance with the highest concentration becomes the critical pollutant for that specific location. If ground level ozone registers at 150 and particulate matter registers at 90, the official index for that day is 150. This mathematical method ensures the public always receives warnings based on the greatest immediate threat.
Reporting only the highest value simplifies the health message delivered to the general public. If news stations broadcasted five different numbers for five different pollutants, viewers would quickly become confused. The single highest number effectively summarizes the worst aspect of the current atmospheric conditions.
The identity of the critical pollutant often changes depending on the season and the time of day. Ozone frequently dominates the readings during hot summer afternoons due to intense solar radiation. Fine particulate matter typically takes over as the primary threat during cold winter nights when people burn wood for heat.
Ways to Protect Yourself When the Air Quality Index Rises
Understanding the daily numbers empowers you to protect your respiratory health proactively. Individuals can significantly reduce their exposure to harmful pollutants by modifying their daily routines.
Planning ahead serves as the most effective strategy for managing environmental health risks safely.
When local monitors report unhealthy conditions, residents should immediately alter their outdoor recreational plans. Even physically healthy adults can suffer permanent lung damage from prolonged exposure to severe pollution.
Checking the daily atmospheric forecast should become as routine as checking the chance of rain. Many smartphones feature built in widgets that display the current local pollution score right on the home screen. Installing a dedicated environmental monitoring application provides convenient access to hourly forecasts and historical trends.
Taking immediate action during pollution spikes actively prevents long term respiratory degradation. Delaying yard work or shifting a jogging routine to an indoor treadmill makes a massive difference in total toxin exposure. Small behavioral adjustments compound over a lifetime to preserve lung capacity and overall cardiovascular health.
Indoor and Outdoor Safety Tips
The most reliable way to avoid outdoor pollution is to remain inside buildings with closed windows and doors. Running air conditioning systems with high efficiency particulate absorbing filters provides an excellent layer of protection against fine particles. People should avoid strenuous physical exercise near busy highways even on moderate pollution days.
Sensitive groups must exercise extreme caution when the index officially enters the orange category. Asthma patients should ensure they have their rescue inhalers readily available at all times. Parents should monitor young children closely for coughing or shortness of breath during any high pollution events.
Using properly fitted respiratory masks offers substantial protection when outdoor travel becomes absolutely necessary during hazardous events. Specialized particulate respirators specifically filter out the dangerous microscopic particles that easily penetrate standard cloth masks. However, individuals must remember that masks do not protect against harmful invisible gases like ozone or carbon monoxide.
Indoor air can sometimes become more polluted than outdoor air if a home lacks proper ventilation systems. However, opening windows during an outdoor smog alert will only pull more toxins directly into your living space. Using portable air purifiers in bedrooms helps create a completely safe breathing sanctuary during prolonged environmental emergencies.
Drivers commuting during heavy smog should set their vehicle climate control systems to recirculate the indoor air. Pulling fresh air from outside while sitting in a traffic jam exposes passengers directly to concentrated exhaust fumes. Regularly replacing the cabin air filter in your personal vehicle ensures the system effectively blocks incoming particulate matter.
Community awareness remains the strongest defense against the hidden dangers of atmospheric pollution. Sharing daily index forecasts with friends and family members helps protect the most vulnerable members of society. By understanding this vital environmental metric, everyone can breathe a little easier and live a healthier life.